1380 Europe and an Emigrant-Exporting Continent
7. Net Revenue (p. 53). - The total revenue derived from the enforcement of the immigration laws during the fiscal year and turned into the general fund of the United States Treasury was $4,651,180.83. Of this amount $4, 285,306.60 is represented by the head-tax collections and $365,874.23 by fines, bond forfeitures, and miscellaneous collections. The net revenue accruing to the Government from the Immigration Service for the year was $1,019,236.07.
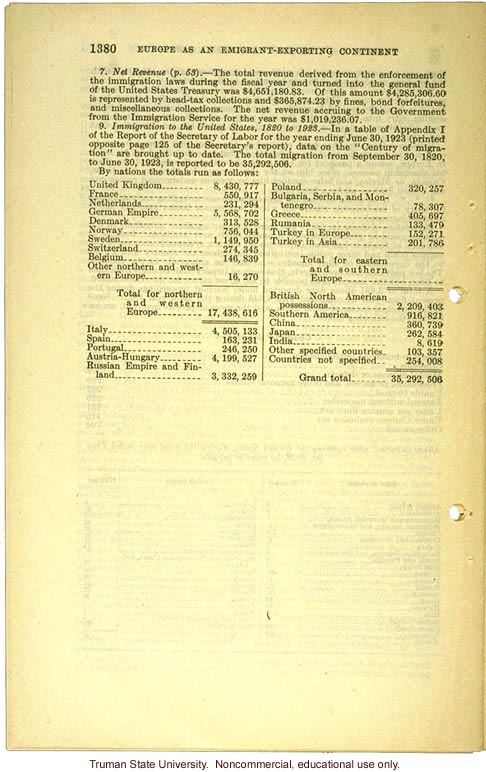
9. Immigration to the United States, 1820 to 1923. - In a table of Appendix I of the Report of the Secretary of Labor for the year ending June 30, 1923 (printed opposite page 125 of the Secretary's report), data on the "Century of migration" are brought up to date. The total migration from September 30, 1820, to June 30, 1923 is reported to be 35,202,506.
By nation the totals run as follows:
[tabular material, two columns, split between name of country and amount]
United Kingdom...&8,430,777
France...&550,917
Netherlands...&231,294
German Empire...&5,568,702
Denmark...&313,528
Norway...&756,044
Sweden...&1,149,950
Switzerland...&274,345
Belgium...&146,839
Other northern and western Europe...&16,270
[single score]
Total for northern and western Europe...&17,438,616
[double score]
Italy...&4,505,133
Spain...&163,231
Portugal...&246,250
Austria-Hungary...&4,199,527
Russian Empire and Finland...&3,332,259
Poland...&320,257
Bulgaria, Serbia, and Montenegro...&78,307
Greece...&405,697
Rumania...&133,479
Turkey in Europe...&152,271
Turkey in Asia...&201,786
[single score]
Total for eastern and southern Europe...
[double score]
British North American possessions...&2,209,403
Southern America...&916,821
China...&360,739
Japan...&262,584
India...&8,619
Other specified countries...&103,357
Countries not specified...&254,008
[double score]
Grand total...35,292,506