ID# 1137: |
"Analysis of America's Modern Melting Pot," Harry H. Laughlin testimony before the House Committee on Immigration and Naturalization | |||
Date: |
1922 |
|||
Source: |
The Harry H. Laughlin Papers, Truman State University, papers, C-2-6,6 | |||

 |
|
| |||||||||||||||||
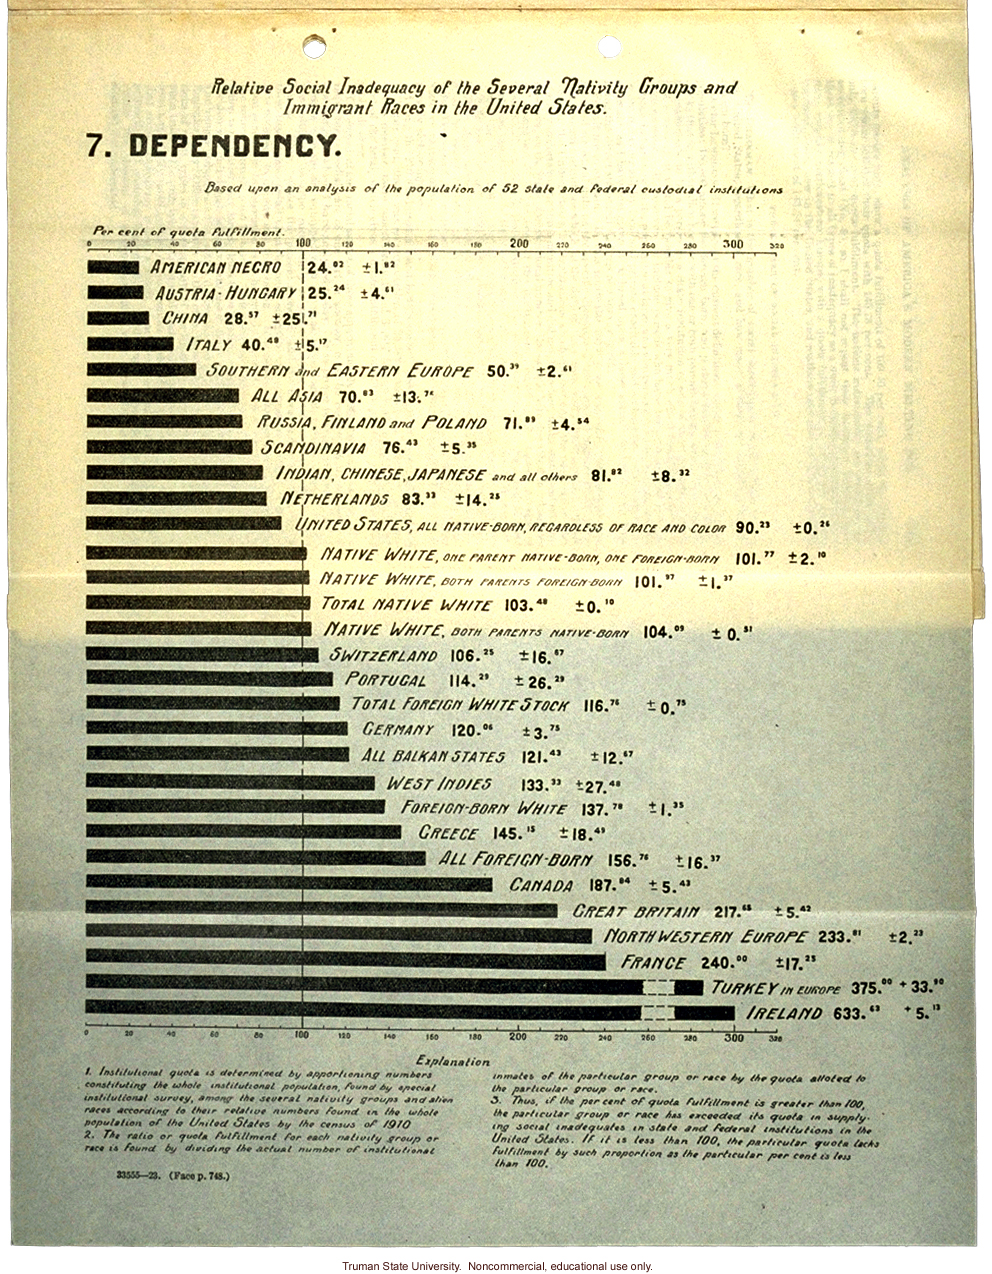
Relative Social Inadequacy of the Several Nativity Groups and Immigrant Races in the United States. 7. Dependency. Based upon an analysis of the population of 52 state and federal custodial institutions. [chart]Per cent of quota fulfillment 0&20&40&60&80&100&120&140&160&180&200&220&240&260&280&300&320 [black bar]American Negro 24.02 [plus or minus sign]1.[illegible]2 [black bar]Austria-Hungary 25.24 [plus or minus sign]4.61 [black bar]China 28.57 [plus or minus sign]25.71 [black bar]Italy 40.40 [plus or minus sign]5.17 [black bar]Southern and Eastern Europe 50.39 [plus or minus sign]2.61 [black bar]All Asia 70.83 [plus or minus sign]13.7[obs type] [black bar]Russia, Finland and Poland 71 89 [plus or minus sign]4.54 [black bar]Scandinavia 76.43 [plus or minus sign]5.35 [black bar]Indian, Chinese, Japanese and all others 81.82 [plus or minus sign]8.32 [black bar]Netherlands 83.33 [plus or minus sign]14.25 [black bar]United States, all Native-Born, Regardless or Race and Color 90.23 [plus or minus sign]0.26 [black bar]Native White, One Parent Native-Born, One Foreign-Born 101.77 [plus or minus sign]2.10 [black bar]Native White, Both Parents Foreign-Born 101.97 [plus or minus sign]1.37 [black bar]Total Native White 103.48 [plus or minus sign]0.10 [black bar]Native White, Both Parents Native-Born 104.09 [plus or minus sign]0.31 [black bar]Switzerland 106.25 [plus or minus sign]16.97 [black bar]Portugal 114.29 [plus or minus sign]26.29 [black bar]Total Foreign White Stock 116.76 [plus or minus sign]0.75 [black bar]Germany 120.06 [plus or minus sign] 3.75 [black bar]All Balkan States 121.43 [plus or minus sign]12.67 [black bar]West Indies 133.33 [plus or minus sign]27.48 [black bar]Foreign-Born White 137.78 [plus or minus sign]1.35 [black bar]Greece 145.15 [plus or minus sign]18.45 [black bar]All Foreign-Born 156.76 [plus or minus sign]16.37 [black bar]Canada 187.84 [plus or minus sign]5.43 [black bar]Great Britain 217.65 [plus or minus sign 5.42 [black bar]Northwestern Europe 233.81 [plus or minus sign]2.23 [black bar]France 240.00 [plus or minus sign]17.25 [black bar]Turkey in Europe 375.00 [plus sign]33.00 [black bar]Ireland 633.63 [plus sign]5.13 [hatched line] 0&20&40&60&80&100&120&140&160&180&200&220&240&260&280&300&320 [end chart] Explanation 1. Institutional quota is determined by apportioning numbers constituting the whole institutional population, found by special institutional survey, among several nativity groups and alien races according to their relative numbers found in the whole population of the United States by the census of 1910. 2. The ratio or quota fulfillment for each nativity group or race is found by dividing the actual number of institutional inmates of the particular group or race by te quota allotted to the particular group or race. 3. Thus, if the per cent of the quota fulfillment is greater than 100, the particular group or race has exceeded its quota in supplying social inadequates in state and Federal institutions in the United States.. If it is less than 100, the particular quota lacks fulfillment by such proportion as the particular per cent is less than 100.